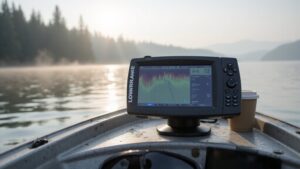
If you’re trying to make sense of your Garmin fish finder display, it can seem like a maze at first. The key is understanding how the screen is divided into different zones, each showing crucial underwater details.
By learning what each area reveals, you’ll turn raw sonar data into a clear picture of what’s beneath your boat.
Keep reading to see how to interpret every part of the display.
The 5 Zones of Your Garmin Sonar Display
Zone 2 is your main sonar image area, providing a live scrolling history of echoes. This zone displays the real-time data of what the sonar detects beneath your boat, allowing you to spot structure, bait, and fish activity as they move through the water. The continuous scroll helps you track movement and identify patterns over time. Unlike standard sonar, CHIRP technology transmits a continuous sweep of frequencies for clearer, more detailed target separation. To complement this reading, selecting a top speedometer for your boat can enhance your overall navigation experience. When choosing a unit, consider which fish finder for boat models best integrate with your existing setup.
Zone 3 features the depth ruler and range scale running along the right side of the display. This scale helps you pinpoint specific target depths without relying solely on the bottom line. It provides a visual reference for understanding how deep targets and fish are situated relative to the bottom, making it easier to adjust your fishing tactics accordingly.
Zone 4 shows raw target marks or fish symbols, representing individual detections. These markers help you distinguish fish from background clutter, offering a more detailed look at what the sonar is picking up. Recognizing fish symbols can guide your decision-making about when and where to cast.
Zone 5 displays the bottom return along with hardness cues that indicate the nature of the bottom surface. This information can help you identify whether the bottom is soft or hard, which is useful for understanding fish habitat and planning your approach. Together, these zones provide a comprehensive picture of what’s happening beneath your boat.

Easy-to-use 4-inch color fishfinder with new vivid scanning sonar color palettes to easily distinguish fish and structure; tilt/swivel bailmount bracket included

Clear Vu scanning Sonar shows you more of what is in the water around your boat; This high frequency sonar gives near photographic images with detailed representations of objects, structure and fish

Rugged, castable sonar device works with the free STRIKER Cast app (compatible with Apple or Android devices) to wirelessly stream sonar, locate fish and display them on your smartphone or tablet
How to Read the Bottom Line for Depth Changes
The bottom line’s angle indicates the change in depth as you move across the water. An upward slant shows you are heading into shallower area, while a downward slope signals deeper water. Sharp angle changes often mean there’s a drop-off, ledge, or channel edge nearby. Gradual slopes suggest rolling terrain with gentle depth shifts. Keep the line positioned in the lower third of your display for clearer tracking of bottom features. A high-quality unit like the Lowrance Elite FS 9 offers excellent sensitivity for detecting these subtle depth changes. Adding a marine stereo that provides clear audio can help you hear alarms for sudden depth shifts while navigating.
Monitor the bottom line’s stability— a thick, continuous line suggests firm, solid ground, while a thin, broken line indicates softer bottom or presence of weeds. Combining the line’s movement with its thickness helps identify terrain types: a bright, solid return often means a hard bottom like rock or gravel, whereas a faint, patchy line hints at softer material such as mud or silt. Don’t judge bottom type from a single snapshot; watch how the line moves over time to better interpret structure edges and changes in the underwater terrain. For crappie fishing, understanding these bottom details is crucial because top fish finders compare features like target separation and sensitivity to locate crappie near structure.
Fish Arches vs. Fish Symbols: Which Should You Use?
When choosing between fish arches and fish symbols on your sonar screen, it’s primarily a matter of how much detail you need versus how quickly you want to interpret the data. Fish arches show the raw sonar signal, capturing the shape of echoes as fish move through the cone. This allows you to observe how sonar interacts with underwater features like vegetation and to see target movement more precisely. Fish symbols, on the other hand, simplify these echoes into icons, making it faster to identify fish at a glance. However, this speed comes with less detail and less accuracy, as symbols are interpretations rather than exact representations. Use fish arches when analyzing weak signals or studying sonar behavior in detail. Opt for fish symbols if you’re a beginner or need rapid identification, but be aware that some Garmin models may not support symbols, so check your device settings. Fish ID features are useful as training tools to help beginners learn how to interpret raw sonar data. For the clearest readings in challenging offshore conditions, you should prioritize a unit with high-quality transducer performance to ensure accurate bottom tracking and target separation, which is essential for locating catfish near deep structure. A boat switch panel can similarly simplify complex electrical controls into easy-to-manage buttons for faster onboard operation.
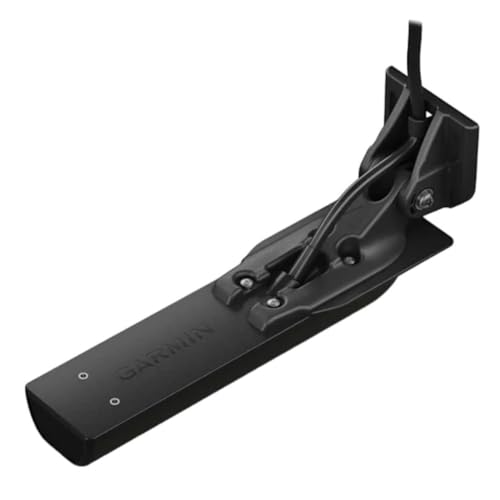
Get Ultra High-Definition SideVü scanning sonar with 20% greater range at 1000 kHz, Ultra High-Definition ClearVü scanning sonar and amazingly clear high wide CHIRP traditional sonar

Includes dual-beam transducer with Garmin Chirp traditional sonar for crystal-clear images and remarkable target separation.Control Method:Touch.Special Feature:Bluetooth.

Easy-to-use 7” color fishfinder with new vivid scanning sonar color palettes to easily distinguish fish and structure; tilt/swivel bailmount bracket included
How to Tell a Fish From a Tree or a Rock
To tell a fish from a tree or a rock, look for a few key visual clues. Fish typically appear as distinct targets above the bottom, often showing a clear shadow underneath in side-scan imagery. This shadow indicates the fish is suspended in the water column rather than attached to the bottom. Trees and logs, in contrast, stay anchored and create irregular, branching structures with uneven outlines. They tend to generate complex shapes with numerous protrusions, making them look like natural debris rather than single targets. On a fish finder, fish often appear as distinct arches on the display when they pass through the sonar cone. Understanding fuel sending unit basics can help boaters avoid misreading sonar returns that are affected by electrical interference from faulty gauges.
Rocks usually form dense, mound-like echoes with hard edges and consistent returns, giving them a solid appearance on the screen. Fish targets are smaller, rounder, and more defined, without the bulk or mound shapes of rocks. Motion detection is especially useful: fish often shift position between pings, while structures like trees and rocks remain fixed. If you see a small, moving mark that casts a clean shadow and has a simple outline, it’s most likely a fish—separating it clearly from bottom-hugging trees or rocks. Fish tend to locate near structures like brush piles or trees, and their distinct shadows help determine their height above the lake bottom.

It is a portable and castable fish finder that comes with a wireless sonar probe/sensor. The maximum distance between the sensor and the handheld unit is 262FT/80M. No need to drill hole in your boat hull to install the sensor any more. Two small holes on the sensor allow you to tether it with your fishing line and cast it onto water as far as you want.

✦ Fish Finder and Depth Finder : It is a portable fish finder that could display approximate fish location and water depth. The sonar transducer can be attached to the hull of kayak or boat in order to understand the changing of water depth when you are moving by. The water depth detection range is between 3ft(1m) and 328ft (100m) when the transducer is completely immersed in the water.

Dual Beam Sonar: Choose from a narrow and a wide beam for great detail or a generous coverage area, helping you identify fish, structure and contours.
What Color Intensity Tells You About Target Density
Bright, consistent returns on your fishfinder display usually indicate denser structures or larger schools of fish. These strong signals are a good sign to focus your attention, as they often represent solid targets. However, too much color intensity or brightness can cause clutter, making it harder to distinguish between different objects or fish. Adjust your gain settings so the display remains clear—targets should be bright but not so oversaturated that details blur together. Maintaining a balanced level helps you accurately interpret target density without losing important information. The gain controls sonar sensitivity, amplifying return echoes to reveal smaller or distant targets when set higher. Properly interpreting these signals relies on understanding the underwater transducer beam and its coverage pattern.
Use Water Temperature and Depth to Find Productive Spots
Water temperature and depth together help you locate where fish are likely holding. Start by reading the surface temperature on your Garmin; even a 1-2 degree change can identify a warm or cool zone that attracts fish. Next, analyze the depth to find the thermocline—a fuzzy band on sonar where temperature drops rapidly. Fish tend to stay above the thermocline because oxygen levels are higher there, supporting active feeding. Understanding this principle relies on accurate water speed readings, which are measured by a pitot tube that uses dynamic pressure to calculate flow past the hull. Repeatedly scan for where this temperature break occurs and note its relation to structural features like drop-offs or points. During summer, fish often congregate at a specific depth where water temperature remains within their preferred range. Mark these spots where the temperature and depth consistently produce successful catches. Focus your casts on these zones rather than unproductive water, saving time and increasing your chances of success by letting temperature and depth guide your fishing strategy. Pairing this sonar data with a remote marine radio from a top brand like Garmin ensures you can communicate spot markings and temperature changes instantly with your fishing partner. For monitoring your boat’s engine health while fishing, consider an electric oil pressure gauge that provides reliable readings to prevent mechanical issues from ruining a productive day on the water.

Delivers uninterrupted depth readings from 2. 5 to 600 feet on the largest display available on an In-Dash Depth Sounder up to 60 mph


Transom Mount 200KHZ Airmar Transducer with Water Temperature Sensor
Gain, Frequency, and Zoom: 3 Sonar Settings That Change Everything
Gain, frequency, and zoom are three sonar settings that fundamentally affect what you see on your screen. Adjusting gain controls how sensitive your receiver is to the returning sonar signals. Set it too high, and noise can obscure your targets; too low, and faint fish or structures won’t show up clearly. Find the right balance by turning gain up until noise appears, then dialing back slightly for a clean image. Frequency selection impacts image detail and depth penetration. Lower frequencies (around 50-100 kHz) go deeper but produce more diffuse images, making them suitable for deep-water fishing. Higher frequencies (200 kHz and above) provide sharper details but are better for shallow water. Zoom enlarges a specific depth zone on the display without altering the sonar signal itself. Use manual zoom to focus on a tight area where your fish or structures are, helping weak echoes stand out more clearly. Remember, gain settings may need adjusting separately for dual-frequency screens to optimize each view. Mastering these three controls allows you to convert raw sonar data into a precise, easy-to-interpret underwater picture. For anglers using forward-facing sonar, a LiveScope transducer mounting is critical for keeping the signal stable and minimizing interference. Choosing the best transducer for your Garmin Striker 4 ensures your sonar settings deliver accurate returns rather than distorted readings. When evaluating performance, a castable fish finder can offer a portable alternative for checking underwater conditions without a fixed mount.

EASY TO SEE: The 4-inch IPS portrait screen stays clear in bright sunlight, from wide viewing angles, and through polarized sunglasses.

Dual Spectrum CHIRP Sonar: Delivers views of fish arches and fish-holding structure with two ways to search — Wide Mode for maximum coverage and Narrow Mode for detailed scanning; Precise 2D target separation powered by Low-Q transducer

PRIMARY COMPATIBILITY: This transducer works best with MarCum MX-7GPS, LX-9, LX-7, LX-6, M5 and LX-5i.
Which Sonar View Works Best for Shallow, Deep, or Structure Fishing?
For shallow water fishing, Perspective mode is the best choice because it provides a broad, top-down view of cover and staging areas. This view helps you spot underwater vegetation, brush piles, or baitfish patterns across flats efficiently. The high-frequency sonar used here offers detailed images at shallow depths, making it easier to identify structure and fish activity close to the surface. Adjusting the gain downward prevents clutter and enhances clarity. Perspective mode is also effective for examining bank edges and horizontal structures, though it may not clearly distinguish fish from rocks in very shallow zones. For those comparing units, reviewing a depth finder for boat guide can help match the best model to your fishing style. A boat speedometer works by using a pitot tube to measure water pressure and convert it into speed readings.
In deep water, switch to Forward LiveScope or Traditional sonar. These views excel at showing suspended fish in the water column and reading depth accurately in areas that extend beyond 100 feet. A lower frequency setting allows for better penetration through the depth, reducing signal loss and echo distortion. Keep in mind that forward-looking views are optimal when tracking fish movement toward your boat, especially around deeper drops or wrecks.
For structure fishing, use ClearVü to get detailed images of the bottom directly underneath your boat, ideal for pinpointing cover like brush, rocks, or drop-offs. SideVü helps you scout off to the sides, revealing cover or fish activity that may be missed by directly beneath views. Perspective mode offers a good balance for these tasks when you need to see how fish relate to horizontal features like ledges or points. Remember to select the appropriate frequency—higher for shallow, lower for deep—and fine-tune the gain to suit water conditions, reducing it in shallow areas and increasing in deeper water.
3 Beginner Mistakes That Ruin Your Sonar Interpretation
Misinterpreting sonar returns is a common beginner mistake that can lead to missed catches or false alarms. Even if your screen is packed with marks, don’t automatically assume every return is a fish. The bold red arch you see might actually be a stump, a rock ledge, or turbulence caused by water movement. Fish ID icons can also mislabel non-targets, so it’s vital to verify the shape and size of each target against its depth and surrounding structure before assuming it’s a fish. Taking a moment to analyze these details helps prevent false positives and improves your overall interpretation accuracy. For example, a rock pile often appears as a wavy line on the display, which beginners may confuse with fish arches or surface waves.