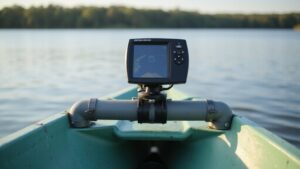
Ever wondered how to interpret what you see on your fish finder’s sonar? It can seem confusing at first, but once you understand the basics, you’ll gain a clearer picture of the underwater world.
By learning how to read fish arches, bottom details, and settings, you’ll be better equipped to locate fish and understand the underwater environment.
The following guide breaks down the essentials to get you started.
Master Your Fish Finder’s Timeline: Why the Screen Moves Left
Because your fish finder’s screen isn’t displaying a live camera feed, it shows a scrolling timeline of sonar echoes moving from right to left. Newest signals appear on the far right, representing your most recent ping. As new data arrives, older echoes shift left, forming a continuous history of sonar returns. This means a fish mark on the far left isn’t a target to your left but an echo detected seconds earlier that’s already behind your boat. Adjusting the scroll speed influences how long past data stays visible on the screen. For beginners, choosing a model with clear sonar returns can make interpreting this timeline much easier. Understanding the anchor light compliance requirements for night navigation can help you avoid confusing sonar history with current vessel position. The sonar’s transducer frequency determines how much detail appears in this timeline.
Your transducer placement influences this timeline’s accuracy and consistency. If the transducer is poorly aimed or mounted in an awkward position, it can cause delays in receiving accurate echoes, making the history on the left less reliable. The scroll speed controls how fast this timeline moves across the screen. A slower scroll keeps each return visible longer, allowing you to examine recent signals more carefully, while a faster scroll compresses the recent history, giving you a quick overview. Remember, the right edge of the display represents “now,” so don’t try to interpret targets on the left as current—they are from the recent past.

Dual Beam Sonar: Choose from a narrow and a wide beam for great detail or a generous coverage area, helping you identify fish, structure and contours.
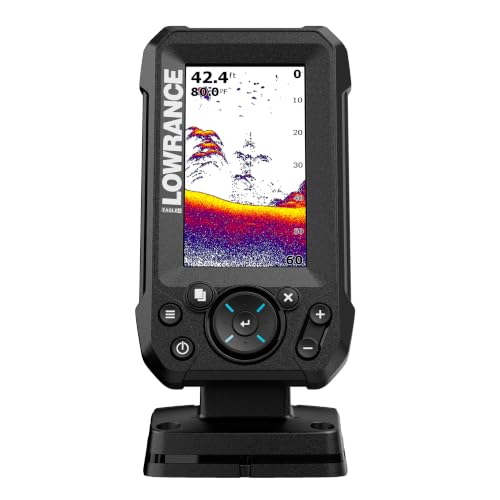
EASY TO SEE: The 4-inch IPS portrait screen stays clear in bright sunlight, from wide viewing angles, and through polarized sunglasses.

FISHREVEAL: Fish are easier to find and easier to identify. FishReveal combines the target separation of Lowrance CHIRP sonar and the high-resolution images of structure from DownScan Imaging to makes fish light up on your display.
The Cone of Confusion: Where Is That Fish *Really* Under the Boat?
The cone of confusion can be quite misleading because the fish’s exact position within the sonar beam is uncertain. Your transducer sends out a cone-shaped sound wave, so at greater depths this cone widens, creating a larger footprint on the sonar display. This results in cone ambiguity: the fish could be anywhere within the circular area of the cone’s coverage. You only know the approximate distance from the transducer, not whether the fish is to the left, right, or directly beneath it. Understanding that signal strength reflects the reliability of target detection helps clarify that fish at the edge produce weaker returns than those directly under the boat. For example, at 30 feet deep, a 20-degree cone covers about a 10-foot-wide area on the bottom. returns from the edge of that cone look identical to those from the center, making it impossible to determine the fish’s precise lateral position. This target uncertainty means a single sonar mark can be deceptive, especially at greater depths. To improve accuracy, watch for repeat returns in the same area as you drift. Consistent marks imply the fish is near the center of the cone, reducing ambiguity. Reposition the boat to pass directly over the suspected fish location for a clearer reading and better chances of pinpointing the target. Keep in mind that arch shapes on the display often indicate a fish moving through the sonar beam, providing additional clues about its behavior and position relative to the cone. For best results on smaller watercraft, consider whether a top depth finder matches your beam angle needs. Just as with a fish finder, the gauge placement is crucial for accurate readings in any instrument.
Tune Your Settings: Speed and Frequency for Clearer Arches
To get clearer arches on your sonar, you need to carefully tune your frequency and scroll speed to match your fishing conditions. First, choose the appropriate sonar frequency: in shallow water, use 200 kHz or high CHIRP for sharper detail and better target separation. For deeper water, switch to 83 kHz or low CHIRP, which offers greater penetration even though it reduces image resolution. To achieve accurate readings, ensure your transducer placement is correct at the back of the boat, as improper positioning leads to poor target arcs or slash lines. Just as a faulty horn relay can cause no sound or erratic beeps, a poorly tuned sonar system will fail to produce clear readings due to inconsistent signal delivery. A secure DIY fish finder mount prevents vibration that distorts sonar images, ensuring consistent readings. Next, adjust your scroll speed based on your boat’s movement. Higher speeds require faster scroll to keep arches from elongating into unrealistic blobs. When trolling slowly or drifting, a moderate scroll speed helps keep the marks visible longer. If you’re stationary, use the slowest setting to avoid a rushed display. Make sure to change one setting at a time so you can see clearly how each adjustment improves arch clarity. For best results, consider upgrading your sonar with top marine speakers to enhance audio feedback from your fish finder.

Dual Spectrum CHIRP Sonar: Delivers views of fish arches and fish-holding structure with two ways to search — Wide Mode for maximum coverage and Narrow Mode for detailed scanning; Precise 2D target separation powered by Low-Q transducer

Complete Kit + Broad Compatibility: Everything you need is in the box—mount base, kayak gear track, transducer arm, and hardware. Compatible with most Garmin, Lowrance, and Humminbird fish finders. One mount, endless possibilities.

2-in-1 Ultimate Angler Combination - Engineered specifically for kayak and SUP anglers, this premium mounting system allows you to install your fishfinder display screen and transducer arm simultaneously on a single sleek setup. No more cluttered decks—just a streamlined, high-efficiency fishing workspace that keeps your essentials perfectly positioned.
Fish Arches Are a Lie: How to Read Real Target Marks
Fish arches are a common sonar reading, but they are misleading. They don’t show the shape of a fish; instead, they represent the timing pattern of a target passing through the sonar cone. A complete arch appears when a fish crosses the center of the beam, while partial arches, streaks, or blobs still indicate a fish that just clipped the edge. For example, a bait ball will often appear as a dense, irregular blob rather than a distinct arch.
Focus on the target’s thickness and brightness. Thicker and brighter marks often mean stronger returns, denser targets, or multiple fish stacked together. Remember, the length of a mark on your screen equals how long the target spends in the sonar beam—not its actual size. Suspended marks that move across different sweeps are more reliable than isolated, static ones. Repeat returns at the same depth indicate a solid fish presence. Disregard arch symmetry since it’s not a reliable indicator of fish shape. Instead, assess targets by their consistency, depth, and movement to read fish behavior accurately. Slowing boat speed enlarges fish images because the increased transducer exposure extends the time fish stay under the beam. For ice fishing, choosing a model with high target separation helps distinguish fish from bait or bottom clutter on your screen. Selecting an anchor light with low power draw is also wise when fishing overnight near shore.

It is a portable and castable fish finder that comes with a wireless sonar probe/sensor. The maximum distance between the sensor and the handheld unit is 262FT/80M. No need to drill hole in your boat hull to install the sensor any more. Two small holes on the sensor allow you to tether it with your fishing line and cast it onto water as far as you want.
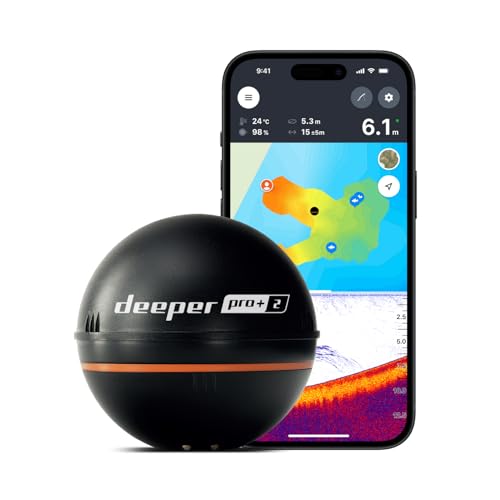
READY TO PERFORM: Wide beam, mid, and narrow beams make covering large expanses or drilling down on specific spots available at your disposal; Ideal for elite anglers who want to take their matchplay to the next level

READY TO GO - Easily find where your next catch is hiding with the Deeper START Fish Finder! The lightweight and sleek design makes for a seamless reel without any messy wires or fiddly external batteries required. Ideal for shore anglers and family trips who want to get on with catching!
Decode the Bottom Return: Hard Rock vs. Soft Mud
A hard rock bottom produces a thick, bright, and sharp sonar return because it reflects more sound energy. This strong reflection often results in a pronounced second echo below the main line. In contrast, soft mud absorbs sonar waves, resulting in a thinner, dimmer, and fuzzier signature. Its return looks less intense, and a second echo is rarely visible. To accurately interpret bottom composition, use a combination of thickness, brightness, and the presence or absence of a second echo. A thick, bright, sharp line with a clear second echo indicates a hard bottom. Conversely, a thin, soft, dim line with no second echo suggests mud or silt. Cross-check these signs across multiple passes to confirm your interpretation. A manual depth setting set at 2-3 times the current depth ensures you can detect the second bottom echoes necessary for evaluating density. Choosing a model with high power helps ensure these faint returns are clearly displayed, and selecting a top fish finder GPS combo designed for clarity can further enhance this process. For best results, also adjust the sensitivity and gain to fine-tune the display.
Spot Bait Clouds and Thermoclines on Your Sonar
Spotting bait clouds and thermoclines on your sonar involves recognizing specific features that influence your fishing. Dense bait clouds appear as cloudlike blobs or pixel storms, often suspended above the bottom, indicating a concentrated baitfish presence. Larger, compact clouds suggest substantial schools worth targeting. Thermoclines manifest as a faint, hazy horizontal band at a consistent depth; increasing manual gain can help reveal this subtle layer, as noise filters often hide faint returns. These layers typically occur deeper in the water column where temperature stratification forms. When bait schools hover just above a thermocline, that depth becomes prime for trolling or vertical jigging. Monitoring bait movement throughout the day—notice if it rises or sinks—can signal shifting feeding windows. Adjust your lure depth accordingly to match the bait’s position and increase your chances of a strike. Real-time detection of the thermocline’s depth varies with water clarity and season, so avoid relying on fixed numbers and always check your sonar. To ensure your sonar setup is reliable, consider pairing it with a quality switch panel for consistent power and clear signal display. Investing in high-performance marine speakers with an amplifier can help you clearly hear sonar alerts and audio cues while on the water. For accurate readings, regularly verify your oil pressure with a reliable mechanical gauge to distinguish between true sonar signals and system noise.

Dual LED Marine Switch: The marine switch of the 6 gang rocker switch panel is dual led marine switch design, choose lower led always on can help you easily locate the switches in dark.

Blue Sea Systems Water-Resistant Circuit Breaker Panel, 6 Positions, Gray. Nominal Voltage: 12V DC, Max Operating Amperage: 45A, Terminal Type: 1/4" Male Quick Connect, Hardware: Stainless Steel 6 x 5/8" mounting screws, Ring Terminal Size: M5 (10).

12/24V, 8 Position Grey Waterproof Switch Panel
How to Tell a Gamefish Arch From a School of Bait
A single, distinct arch is your best indicator of a gamefish passing through the sonar beam. When a predator fish moves close to your transducer, it creates a thicker, brighter, and more solid arch compared to the surrounding bait schools. The shape peaks when the fish is directly beneath or closest to the transducer, resulting in a full, intense arch. If you see only a partial or faint arch, that typically means the fish crossed only the edge of the sonar beam, not the center. Bait schools, on the other hand, usually appear as fuzzy balls or dense pixel storms rather than clean, solid marks. For catfish specifically, look for a best fish finder that offers high-resolution sonar to clearly distinguish these arches from bottom structure. Fish behavior also provides clues: an additional arch appearing beside or below a bait cloud signals a predator actively tracking the school, rather than a group of baitfish itself. Rely on the shape and brightness of the arch to distinguish a gamefish from bait.

【𝐄𝐚𝐬𝐲 𝐭𝐨 𝐔𝐬𝐞 】 Reelsonar portable fish finder is Easy to use, With a depth range of 135 feet and rechargeable battery life of 10+ hours, IOS and Android apps Bluetooth fishfinder with sonar

✦ Fish Finder and Depth Finder : It is a portable fish finder that could display approximate fish location and water depth. The sonar transducer can be attached to the hull of kayak or boat in order to understand the changing of water depth when you are moving by. The water depth detection range is between 3ft(1m) and 328ft (100m) when the transducer is completely immersed in the water.
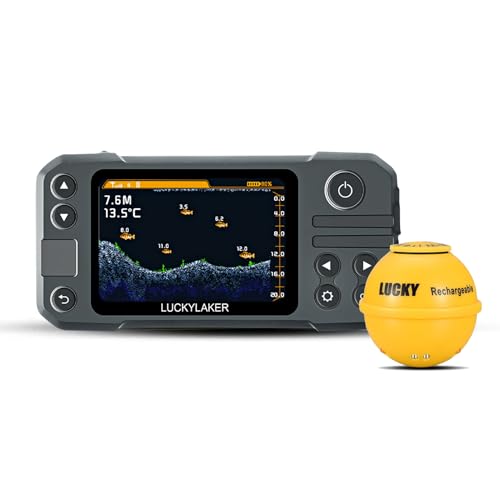
Wireless Control & Operation : Experience the ultimate freedom with the LUCKY portable fish finder, featuring a MASSIVE 853FT OPERATION DISTANCE—one of the longest ranges on the fishing market! No wires. No limits. Just cast your sonar sensor and unlock the secrets below from your boat, kayak, or shore.
Trust, But Verify: Use Multiple Passes to Confirm What’s Below
Running at least two passes over the same area ensures you confirm what’s actually below. Since a single sonar view can easily be misleading, targeting consistency is key—if a mark remains in the same position across multiple scans, it’s likely a true structure or a fish. To validate signals, change your heading on the second pass; a different angle reveals shape, relief, and shadows that a straight scan might miss, helping you distinguish hard bottom from clutter. Use side imaging to map wider areas and down imaging to verify texture details. Comparing 2D arches with these views clarifies what’s real. Mark edges with waypoints and slow down during subsequent passes to scrutinize suspicious spots. Look for signatures that repeat—thick bottom lines, clustered returns, stable depths—as they build confidence. If a mark shifts or disappears between passes, it’s probably noise; stable echoes are worth investigating further. For a device with strong performance and high value, the EchoMap UHD 93SV with GT54 transducer offers clear high-frequency returns that help confirm structures on multiple passes. Proper settings, such as keeping noise rejection off or low and sensitivity within a few clicks of auto, prevent false marks from misleading your confirmation.